7.5 Observability
7.5 Observability
7.5.1 Tracing
Tracing provides an end-to-end view of a single request or workflow as it traverses multiple components within an agentic system and its dependencies. While logging provides events and metrics provide aggregated data, tracing connects related operations, allowing developers to visualize the entire journey of a task through the agent's architecture. Key aspects of tracing include:
- Distributed Trace IDs: Unique identifiers that propagate across all services and components involved in a single task, allowing for correlation of log entries and metrics.
- Spans: Individual operations or logical units of work within a trace, each with its own start and end time, attributes (e.g., service name, operation name), and parent-child relationships.
- Causality: Understanding the causal relationships between different operations, identifying dependencies and potential bottlenecks.
Tracing is particularly valuable for understanding the performance characteristics of complex agent workflows, especially those that involve interactions with external APIs, databases, or other microservices.
7.5.2 Logging
Logging for agentic AI systems should adhere to a structured format such as JSON or a similar machine-readable format, rather than unstructured text. Structured logs allow for easy parsing, filtering, and analysis by automated tools, facilitating efficient debugging and root cause analysis. Key information to capture in logs includes:
- Agent Actions: What decisions the agent made, what actions it attempted, and the outcome of those actions (e.g., successful API call, failed data retrieval).
- Input and Output: The specific inputs the agent received and the outputs it generated at various stages of its execution.
- Internal State Changes: How the agent's internal state, knowledge base, or memory evolved during its operation.
- Errors and Exceptions: Detailed information about any errors, warnings, or exceptions encountered, including stack traces and relevant context.
- Timestamps and Durations: Accurate timestamps for each log entry and the duration of specific operations to identify performance bottlenecks.
- Contextual Information: Unique identifiers for specific tasks, sessions, or workflows to enable correlation across different log entries.
Effective structured logging provides a granular view of the agent's internal workings, allowing developers to reconstruct its decision-making process and understand why certain behaviors occurred.
7.5.3 Metrics
Metrics provide quantifiable measurements of an agent's performance, resource consumption, and overall effectiveness. Key categories of metrics for agentic AI include:
- Performance Metrics:
- Latency: Time taken for the agent to respond to a query or complete a sub-task. Throughput: Number of tasks processed per unit of time.
- Success Rate: Percentage of tasks successfully completed without errors.
- Resource Utilization Metrics:
- CPU Usage: Percentage of CPU cores utilized by the agent.
- Memory Usage: Amount of RAM consumed by the agent.
- Network I/O: Data transferred in and out by the agent (e.g., API calls, database interactions).
- GPU Usage: For agents leveraging accelerators.
- Task Completion Metrics:
- Task Completion Rate: Percentage of assigned tasks that reach a final successful state.
- Average Task Duration: The average time taken to complete an entire end-to-end task.
- Task Backlog: Number of pending tasks waiting for the agent to process.
These metrics should be collected and visualized in dashboards to provide real-time insights into the agent's health and operational efficiency. Alerting mechanisms can be configured based on predefined thresholds to notify operators of potential issues.
7.5.4 Observability Requirements Framework
The observability requirements framework provides a structured approach to implementing monitoring and visibility across your agentic systems. This framework organises requirements into six operational categories, each addressing distinct aspects of agent system performance, safety, security, operation, and governance.
**How to Use This Framework ** 1. Evaluate key factors before defining requirements.
- Operational Environment: Domain criticality, user impact, existing operations
- Agent Characteristics: Autonomy level, task complexity, tools integration, learning capability
-
Organisational Constraints: Regulatory requirements, existing infrastructure, technical expertise, and risk tolerance.
-
Determine your risk level
Regardless of data classification, you will need to assess your system’s risk level to determine which telemetry requirements are mandatory:
- No-Risk Operations: Local development or POC systems with no operational impact.
- Low-Risk Operations: Internal agency usage with minimal impact on operations and/or strong human-in-the-loop oversight.
-
High-Risk Operations: Production systems with significant operational impact (e.g., external contractors, citizens).
-
Apply the Requirements Framework
Use the observability requirements table and adapt it to your situation based on the mandatory telemetry requirements matrix below.
Telemetry Type Indicators: - 🤖: Agent-Level Observability Telemetry – Captures what the agent actually did in a task/session (prompts, responses, tool calls, memory access, traces) so agent behavior can be reconstructed for debugging, audits, and root cause analysis. - 🔐: Security-Related Telemetry – Detect and investigate security and abuse risks (unauthorized access, prompt injection, data exfiltration, privacy breaches) and provide defensible audit trails. - 🚧: Safety/Ethics-Related Telemetry – Measure whether the system is causing or enabling harm (toxicity, harmful content, bias, unsafe advice). - 📈: Performance-Related Telemetry – Operational metrics used to optimize cost, latency, throughput, and user engagement; not strictly required from a safety/security policy lens. - 🏛️: Governance/Oversight-Related Telemetry – Captures audit, accountability, and compliance-related telemetry to ensure responsible operation of agentic systems across their lifecycle.
Collection Difficulty Indicators: - 🟢: Easy to Collect - Uses existing application logs or basic instrumentation; can be computed with simple aggregations (counts, averages) using standard logging/metrics infrastructure. - 🟠: Moderately Difficult to Collect - Requires structured logging plus some statistical analysis or event correlation (e.g., joining multiple logs, computing drift/bias metrics, building evaluation jobs). - 🔴: Very Hard to Collect - Requires advanced analytics and human-labelled ground truth or specialized detection models (e.g., hallucination, bias, fairness metrics, ungrounded response rate).
Mandatory Telemetry Requirements Matrix:
The table below shows which telemetry is mandatory, waivable, or recommended but not mandatory based on your risk level and telemetry characteristics:
| Risk Level | Agent-Level/Security-Related Telemetry | Safety/Performance/Governance-Related Telemetry |
|---|---|---|
| No-Risk Operations | 🟢 Recommended | 🟢 Recommended |
| 🟠 Recommended | 🟠 Recommended | |
| 🔴 Recommended | 🔴 Recommended | |
| Low-Risk Operations | 🟢 Mandatory | 🟢 Waivable |
| 🟠 Waivable | 🟠 Recommended | |
| 🔴 Recommended | 🔴 Recommended | |
| High-Risk Operations | 🟢 Mandatory | 🟢 Mandatory |
| 🟠 Waivable | 🟠 Waivable | |
| 🔴 Recommended | 🔴 Recommended |
Legend: - Mandatory: Must be implemented; no waiver allowed - Waivable: Must be implemented unless a waiver is obtained with documented risk acceptance - Recommended: Strongly encouraged but not required; implement based on your specific needs and constraints
Important Note: When a telemetry spans across different telemetry types (e.g., tagged with both 🤖 and 🚧), follow the strictest condition when determining its requirements. For example, if a telemetry item is marked as both 🤖 (Agent-level) and 🚧 (Safety/ethics), treat it according to the 🤖 requirements, which are stricter.
Implementation Strategy
- Phase by Priority: Assess which requirements are more critical. Implement them first, before expanding further.
- Validate Regularly: Review implementation against the requirements table to maintain mandatory coverage.
- Plan for Evolution: Build flexibility to accommodate changing requirements as agent systems and organisational needs mature.
Terminology Definition:
The figure below illustrates the hierarchical structure of these components in an Agentic system, where a session contains one or more user queries, each triggering agent-level tasks composed of multiple execution-level requests.
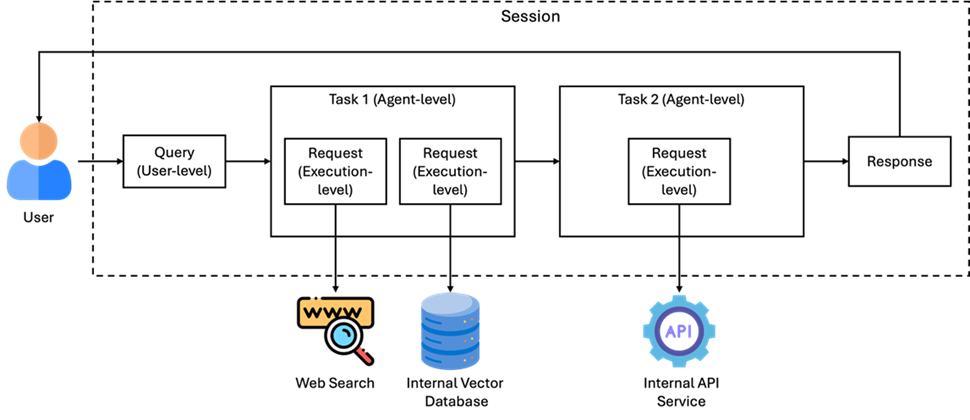
- Query (user-level): A user-issued natural language prompt or input to the system. It initiates a session or task.
- Task (agent-level): A discrete goal that the agent attempts to fulfill in response to a query. Task execution may be iterative, involving clarification loops where the agent requests additional information from the user to refine its understanding before proceeding. A task may require multiple reasoning steps, subtasks, or tool invocations (e.g., clarify parameters → search → summarize → respond). It is the unit of agent execution and may be multi-step.
- Request (execution-level): A specific operation or API call performed by the agent during a task. Multiple requests make up the actions of a single task.
- Session: A complete unit of interaction between the user and the system, encompassing one or more queries and all downstream agent tasks and requests.