Chapter 6E: Model Monitoring and Observability Implementation
Introduction
In this subchapter, we continue with the resale price prediction case study from Chapter 5 and extend it with a production-grade observability layer. You will see how a SageMaker project is advanced from MLOps Stage 1 → Stage 2 by wiring CloudWatch + ADOT + Amazon Managed Prometheus (AMP) + Grafana, and by enabling SageMaker Model Monitor (data quality, model quality, explainability). The result is a single, consistent place to monitor infrastructure health (latency, errors, utilisation) and model health (data quality, accuracy, explainability) across different environments (i.e., Dev/UAT/Prod) in real time.
It is important to note that our architecture design is crafted specifically for the resale price prediction use case. Different ML applications will have different contexts and monitoring needs. The observability setup demonstrated here provide a foundation, but should be adapted based on your specific use case, business requirements and operational constraints. Furthermore, the setup below assumes you already have the basic MLOps infrastructure in place, including the CI/CD pipeline, model registry, build & deploy covered in earlier sections. If you are starting from scratch and feel lost, reach out to us or refer to the foundational setup described in chapter 5A to 5F for the baseline infrastructure before implementing this observability layer.
Architecture Design
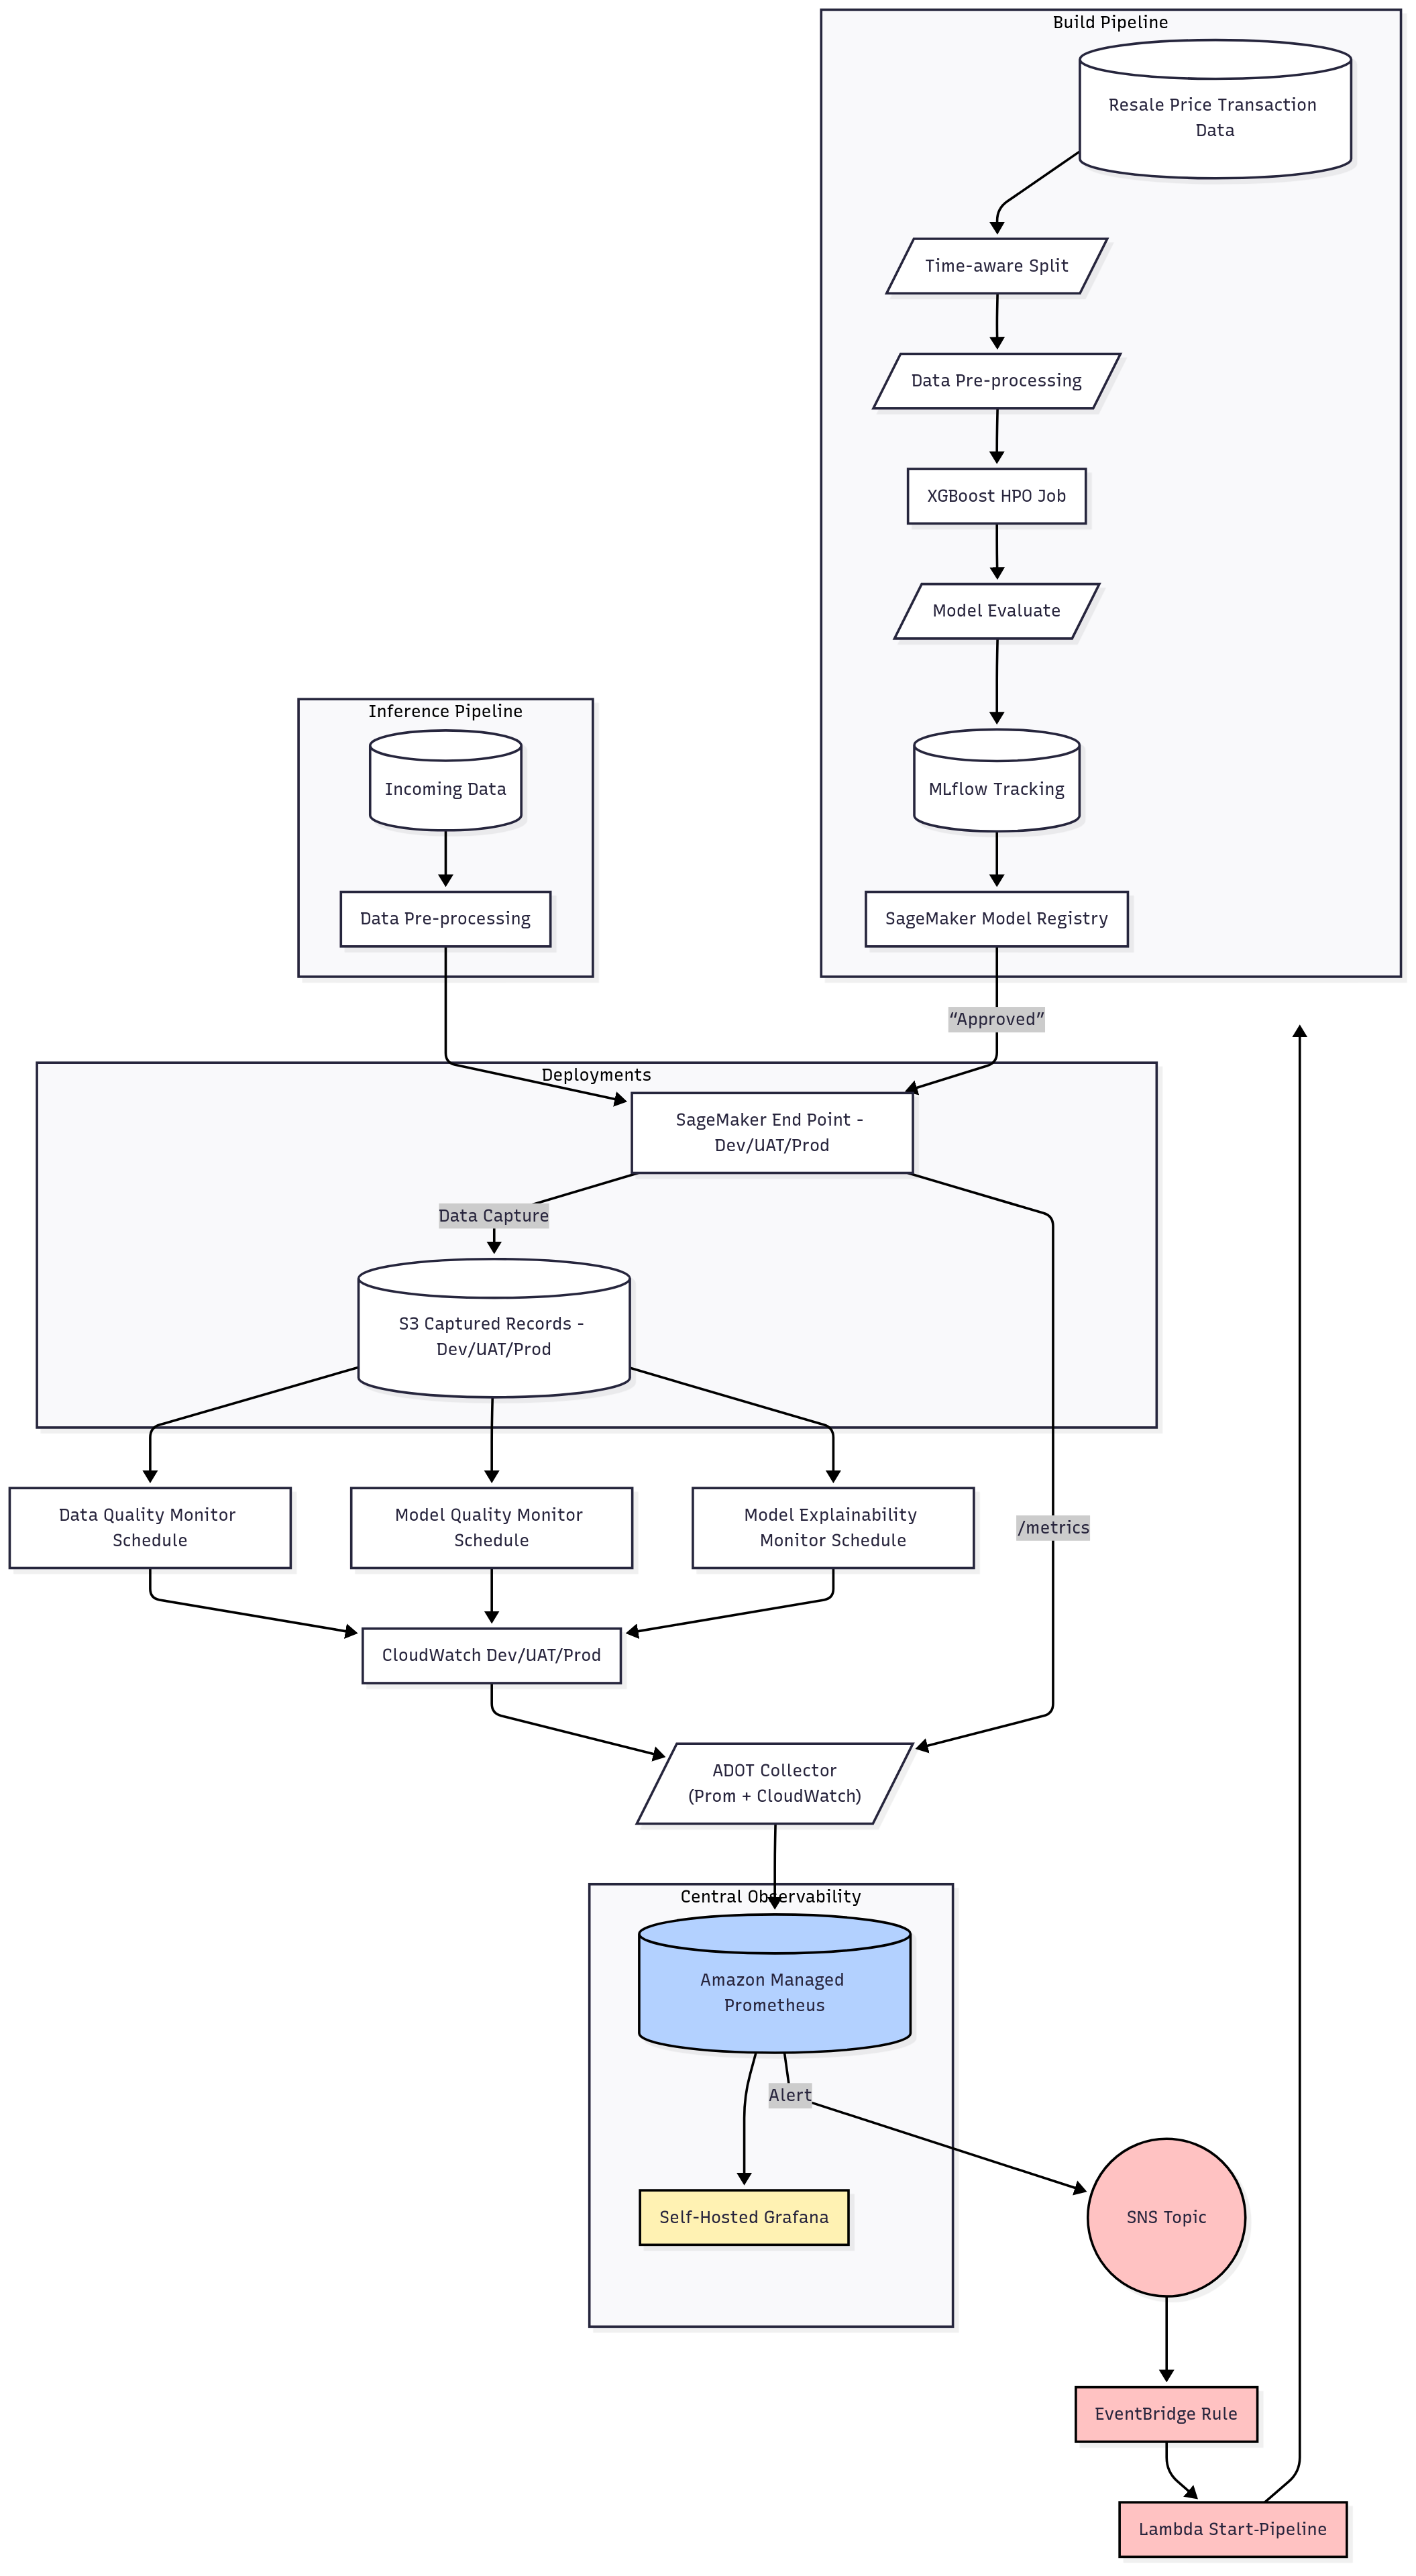
The architecture design above weaves observability through the entire ML lifecycle by fitting together the following pieces:
-
Build Pipeline
- The pipeline ingests the Resale Price Transaction Data, performs a time-aware split, pre-processing, and runs an XGBoost HPO job.
- Results are evaluated, tracked using MLflow, and the approved model is pushed to the SageMaker Model Registry.
-
Endpoint Deployment
- Approved models are deployed as SageMaker Endpoints in Dev / UAT / Prod environments.
- Data capture is enabled and request/response payloads are written to S3 (per-environment prefixes).
-
Model Monitoring Schedules
- Three SageMaker model monitoring schedules are created to regularly monitor the captured data in S3:
- Data Quality (tracks data schema, completeness, drift/constraint violations)
- Model Quality (tracks metrics such as RMSE/R² for regression)
- Model Explainability (performs SHAP-based drift/importance monitoring)
- Each schedule writes metrics/events to CloudWatch Metrics and artifacts to S3.
- Three SageMaker model monitoring schedules are created to regularly monitor the captured data in S3:
-
Metrics Collection and Forwarding
-
CloudWatch holds both endpoint metrics (invocations, latency, 4xx/5xx, CPU/Memory/Disk) and monitor metrics (violations, RMSE, etc.) for each environment.
-
An ADOT Collector (deployed on ECS/Fargate) scrapes the CloudWatch Exporter and forwards the normalised Prometheus series to an Amazon Managed Prometheus (AMP) via remote-write. This keeps labels consistent (e.g.,
environment,project,endpoint,schedule). -
Central Observability
-
An Amazon Managed Prometheus (AMP) workspace serves as a central source of observability by storing all relevant time-series metrics from different environments.
-
A self-hosted Grafana instance connects to AMP to provide teams with:
- Environment-scoped dashboards (Dev / UAT / Prod)
- Panels for endpoint health, traffic/latency distributions, error rates, Model Monitor KPIs, and explainability shift
-
Alerting and Automation
-
Any alerts from AMP/Grafana will be routed to SNS to notify the relevant teams for further investigation.
- EventBridge filters messages (e.g.,
environment=prod,action=retrain). - A Lambda function is used to trigger the SageMaker pipeline to retrain automatically after critical model-quality violations or elevated error-rates, while still supporting human-in-the-loop for review-only alerts.
Best Practices
- Clear environment boundaries: Dev/UAT/Prod have isolated capture paths, monitoring schedules, and metric labels. This avoids cross-talk and accidental alert storms.
- Uniform telemetry: Infrastructure and model metrics share label sets, making cross-correlation (e.g., “did RMSE worsen when P95 latency spiked?”) straightforward.
- Minimal code intrusion: Most signals come from CloudWatch, Model Monitor, and the exporter/collector path so your model code stays clean.
- Actionable alerts: Critical conditions (5xx spikes, data-quality violations) can automatically trigger retraining, while non-critical drift can notify teams for investigation.
This design reflects our best attempt to cover the majority of use cases we have encountered across agency teams. However, any specialised requirements/use cases (e.g., stricter data classifications, unique governance requirements, or alternative technology stacks) may require more targeted adjustments to this design. Even so, we hope this architecture provides a solid starting point for agencies beginning to add model observability to their existing ML setups.
Step-by-Step Practical Implementation (with code walkthrough)
This section walks through a working GitHub repository that implements a full observability layer for the HDB Resale Price Prediction use case.
What you will get at the end of this walkthrough:
* A SageMaker pipeline that trains a regression model on the HDB resale price dataset stored in S3, evaluates it, and registers it (when it satisfies certain user-defined thresholds).
* A deployment layer to stand up a SageMaker-managed endpoint.
* Deploy monitoring schedules for data quality, model quality, and model explainability checks.
* A fully wired observability stack: CloudWatch → (CloudWatch Exporter) → ADOT Collector → Amazon Managed Prometheus (AMP) → Self-hosted Grafana.
* Alerting + Auto-retraining: AMP Alertmanager → SNS → EventBridge → Lambda → StartPipelineExecution.
0) Clone & Inspect the Repository
git clone https://sgts.gitlab-dedicated.com/wog/gvt/dsaidquantitativ/qs-central/mlops/resale-price-mlops-project
cd resale-price-mlops-project
The layout of the repository is as follows:
resale-price-mlops-project/
├─ README.md
├─ config.py
├─ setup.py
├─ setup.cfg
├─ tox.ini
├─ .gitignore
├─ .gitlab-ci.yml
├─ requirements.txt
├─ tests/
│  └─ test_pipelines.py
├─ pipelines/
│  ├─ get_pipeline_definition.py
│  ├─ run_pipeline.py
│  ├─ _utils.py
│  ├─ __version__.py
│  └─ __init__.py
├─ model_code/
│  ├─ pipeline.py
│  ├─ preprocess.py
│  ├─ evaluate.py
│  ├─ mlflow_logging.py
│  ├─ lcc-init-script.sh
│  └─ __init__.py
├─ adot-cloudwatch-exporter/
│  ├─ Dockerfile
│  ├─ build_and_push_image_to_ecr.sh
│  ├─ entrypoint.sh
└─ code_deploy/
   ├─ create_aws_roles.py
   ├─ deploy_prometheus.py
   ├─ deploy_sagemaker_endpoint.py
   ├─ deploy_monitoring_jobs.py
   ├─ deploy_cloudwatch_adot_amp.py
   ├─ deploy_selfhosted_grafana.py
   ├─ deploy_sns_lambda_eventbridge.py
   └─ test_endpoint_monitoring.py
1) Create a Virtual Environment and Install Project Dependencies
You’ll need AWS credentials with permissions for SageMaker, ECR, ECS, AMP, CloudWatch, SNS, Lambda, and EventBridge.
2) Push Code → Run the SageMaker Pipeline (CI/CD)
This repository contains a GitLab CI/CD pipeline (see .gitlab-ci.yml) that packages and runs the SageMaker pipeline automatically whenever the repository branch is updated with a new code push.
What happens:
model_code/preprocess.pypreprocesses and builds features from the HDB resale transaction dataset stored in S3.- The training step (XGBoost HPO or trainer) fits a regression model with a range of hyperparameters to identify the optimal settings.
model_code/evaluate.pyevaluates the best performing model on a test dataset based on a variety of metrics (e.g., RMSE/R²/MAE/MSE).- Models that successfully satisfied the user-defined performance thresholds are registered to the Model Registry.
3) One-time Setup: Build & Push the ADOT + CloudWatch Exporter Image
This script builds a local Docker image containing the CloudWatch Exporter (exposes /metrics on 9106) and ADOT Collector (scrapes 9106; remote-writes to AMP with SigV4), before pushing it to Amazon ECR.
4) One-time Setup: Create IAM Roles & AMP Workspace
# Creates/updates the execution roles for the observability pipeline
python -m code_deploy.create_aws_roles

# Creates (or reuses) an AMP workspace; prints Workspace ID + remote_write URL
python -m code_deploy.deploy_prometheus
5) Update config.py
The config.py file needs to be updated with the outputs from the previous steps:
* Role ARNs from create_aws_roles.py,
* AMP Workspace ID and remote_write URL from deploy_prometheus.py,
* VPC/Subnets/SecurityGroups for your environment(s).
6) Deploy the SageMaker Endpoint with Data Capture Activated
This script creates/updates Model, EndpointConfig, and Endpoint. It also enables data capture to S3 (see config.py paths) so monitors can read payloads.
7) Create Monitoring Schedules (Data Quality, Model Quality, Model Explainability)
What it configures:
- Data Quality: Regular data monitoring comparing live data payloads against baseline schema/stats.
- Model Quality: Generates predictions for baselining; Compares against ground truth labels stored in S3.
- Model Explainability: Compare SHAP baselines and periodic drift summaries of incoming data.
8) Stand Up the ADOT Collector Service (ECS/Fargate) and Remote Write to AMP
This service:
* Scrapes the CloudWatch Exporter
* Adds consistent labels (environment, project, endpoint, schedule)
* Remote-writes to your AMP workspace to form a central observability layer
9) Deploy a Self-hosted Grafana
The code deploys a self-hosted Grafana server, which the user will have to access via the Grafana UI to perform the following configurations:
* Add AMP + CloudWatch as data sources.
* Create starter dashboards with template variables ($env, $endpoint, $schedule) to avoid dashboard sprawl.
* Use folder-level RBAC for Data Science / MLE / Ops views.
10) Alerting and Auto-Retrain (SNS → EventBridge → Lambda)
- Uploads Alertmanager definition + Prometheus rule groups to AMP (4xx/5xx, data quality violations, SHAP shift).
- Creates an SNS topic and subscribes your emails.
- Installs an EventBridge rule that matches
environment=<env>andaction=retrainattributes from alerts. - Invokes a Lambda that calls
sagemaker:StartPipelineExecutionto retrain automatically when critical conditions are met.
11) Validation
If everything is deployed properly, you should be able to observe the following:
* SageMaker: Endpoint is InService; data capture files appear in S3.
* CloudWatch: Endpoint metrics and monitor metrics are visible.
* AMP/Grafana: Time series appear; dashboards show traffic, latencies, violations.
* Alerts: Trigger thresholds → alert → SNS email; EventBridge filter routes retrain actions to Lambda.
Concluding remarks
By following this subchapter, you have expanded your baseline MLOps to include the final layer of observability, successfully transitioning from MLOps Stage 1 to Stage 2 with:
- Automated training & registration with reproducible pipelines
- Governed promotion & deployment across Dev/UAT/Prod environments
- Always-on monitoring (data quality, model quality, model explainability)
- Centralised observability via CloudWatch → ADOT → AMP → Grafana
- Actionable alerting with a safe, auditable path to auto-retrain
A successful execution gives your agency stakeholders confidence that models remain accurate, fair, and performant, while enabling your technical teams to detect and remediate issues proactively before they affect users.