Visual walkthrough
These fictional views demonstrate how ORF evidence can appear in an operating product. They are design references, not prescribed dashboard layouts.
ORF decision flow
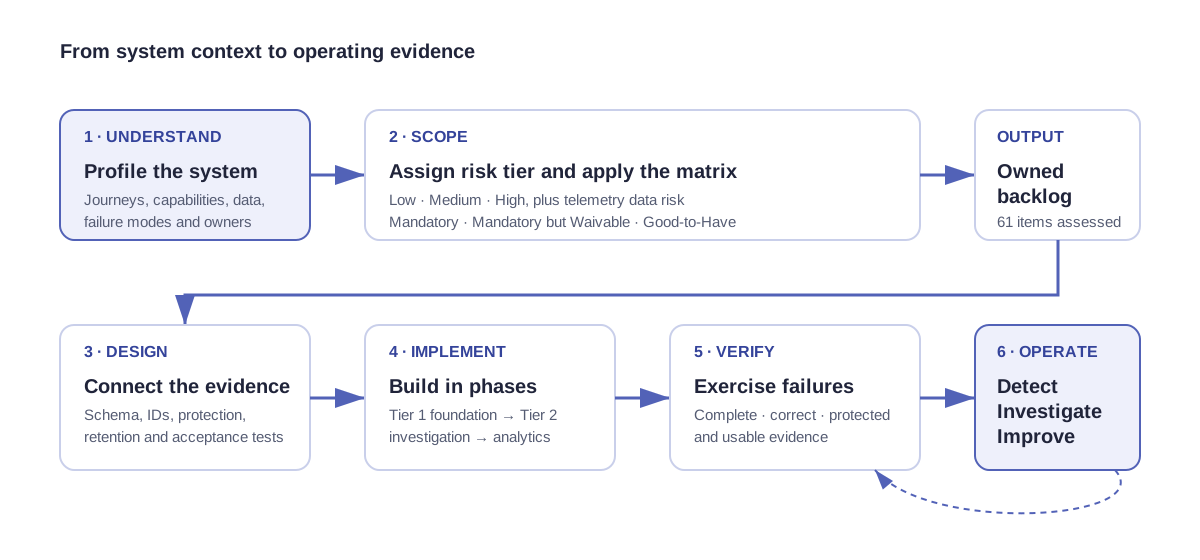
The flow separates system risk from telemetry priority, then continues through design, implementation, verification, and operational use.
Logical reference architecture
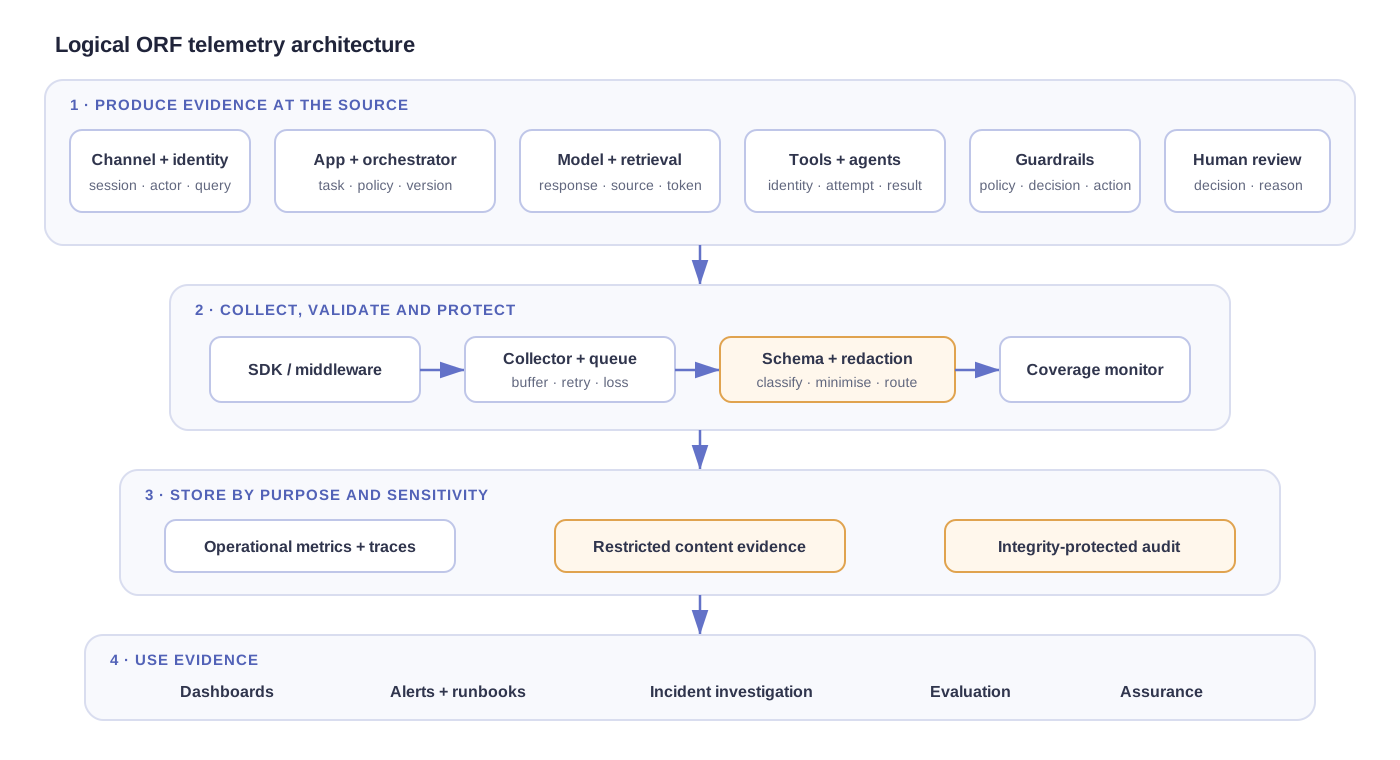
The important design choice is not a specific product. It is the separation of source instrumentation, collection/protection, purpose-specific storage, and evidence use.
Evidence lifecycle
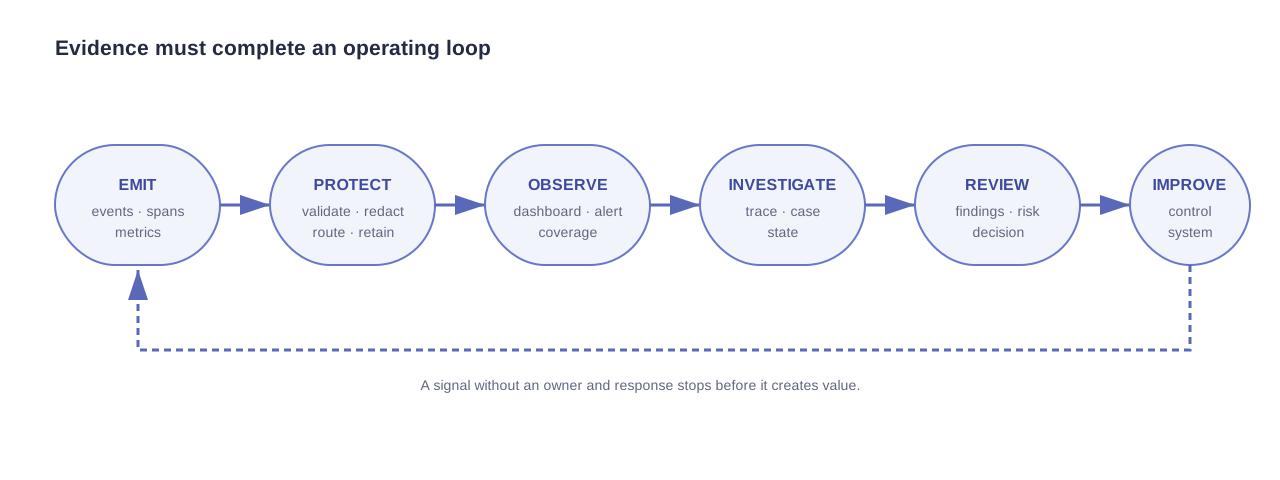
Evidence creates value only when it reaches an operating decision and feeds an improvement back into the service or control.
Example service and safety dashboard
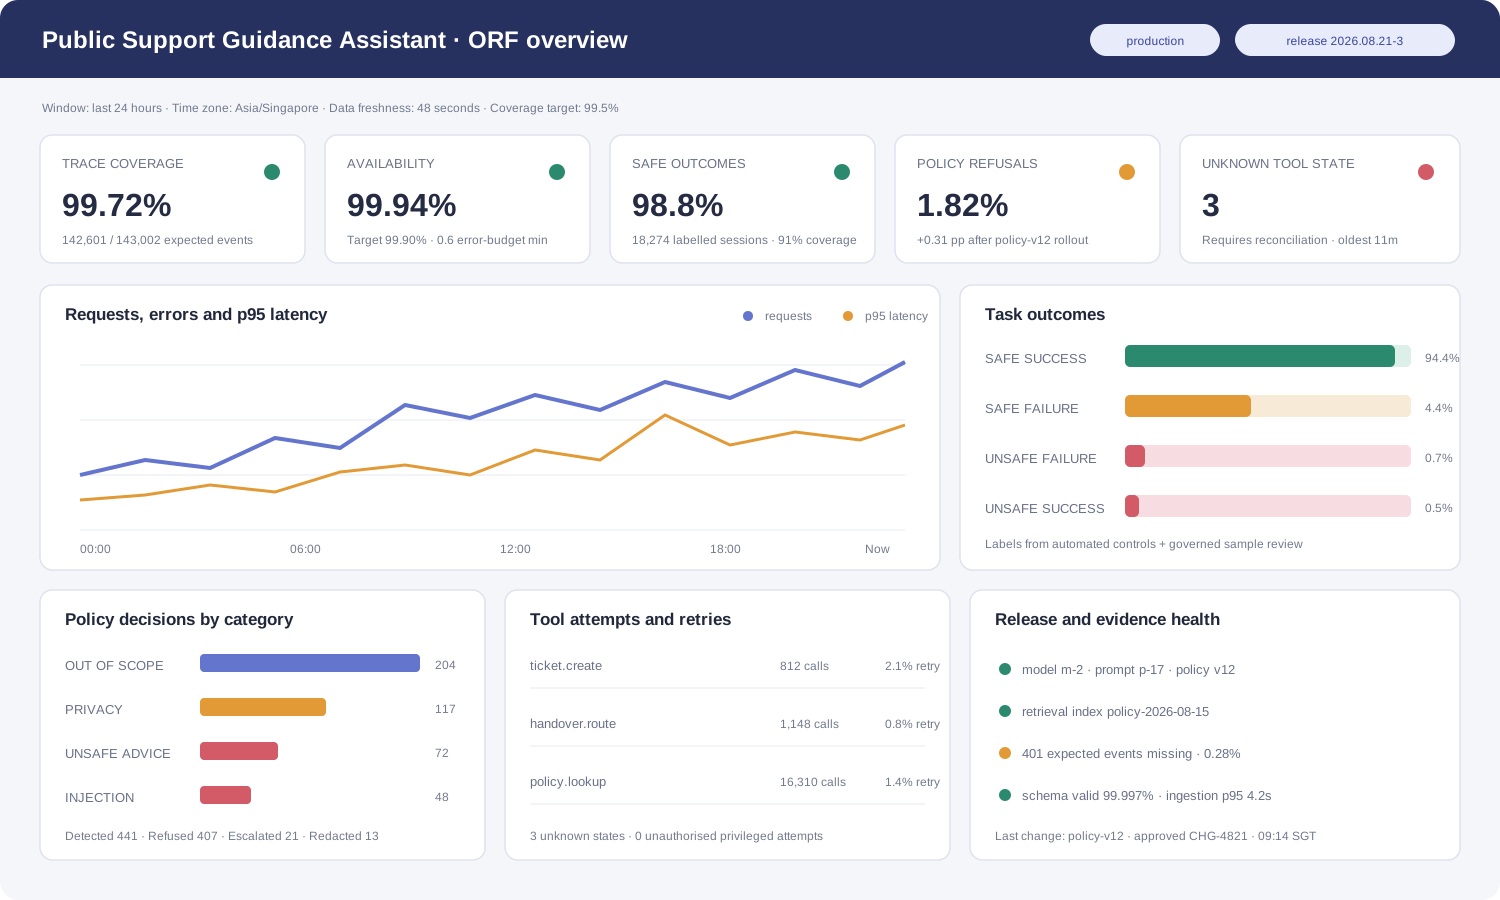
The mock dashboard combines evidence health, conventional reliability, AI task outcomes, policy decisions, tool behaviour, and release context. Counts, denominators, coverage, versions, and timestamps remain visible.
Example investigation trace
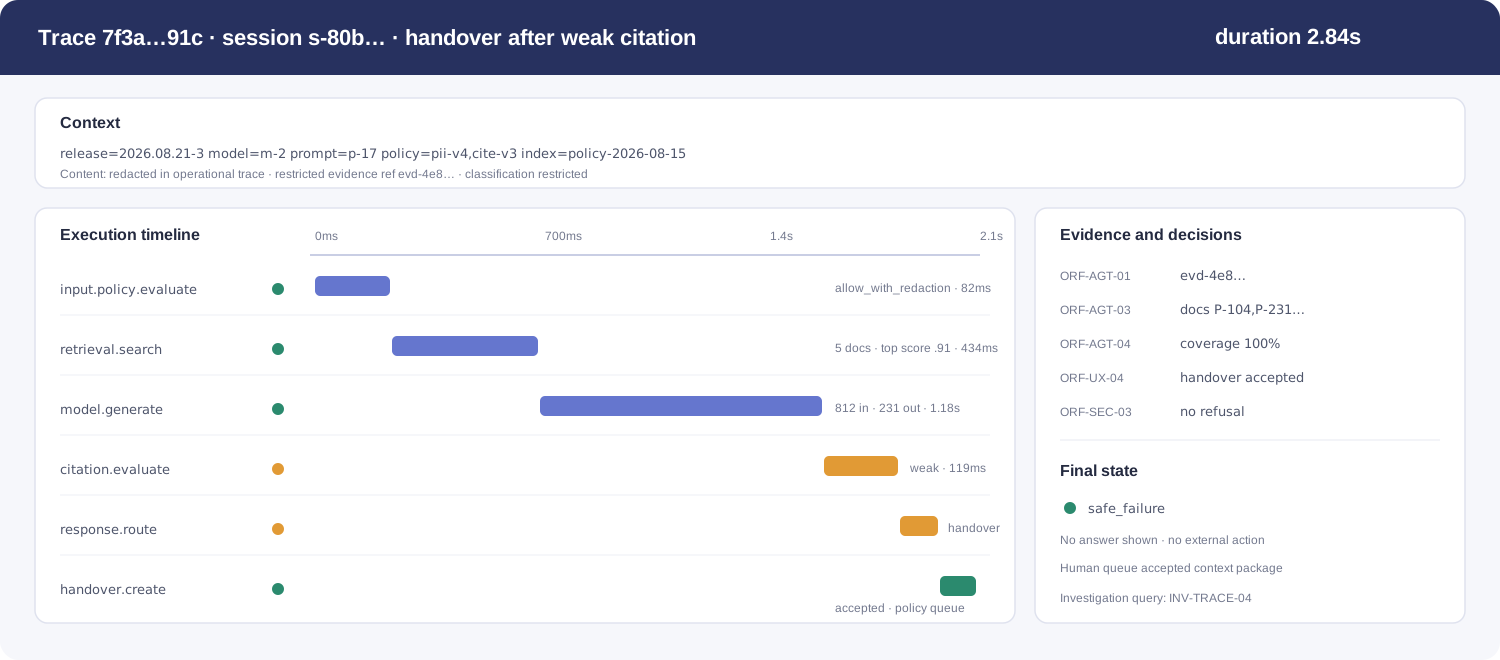
The trace shows a safe failure: a weak citation triggers handover, no answer is shown, and an authorised investigator can follow the relevant ORF evidence without placing raw content in the operational view.
How to adapt these visuals
- retain the evidence-health indicators even if the platform separates dashboards;
- keep trace, version, change, and case references connected;
- remove panels that do not lead to a decision;
- add domain-specific outcome and external-action state; and
- keep restricted content out of screenshots, notifications, and general dashboards.
Next: Metric examples