Dashboards and alerts
Dashboards support diagnosis and review. Alerts should identify a condition that requires timely action. Avoid turning every ORF metric into an alert.
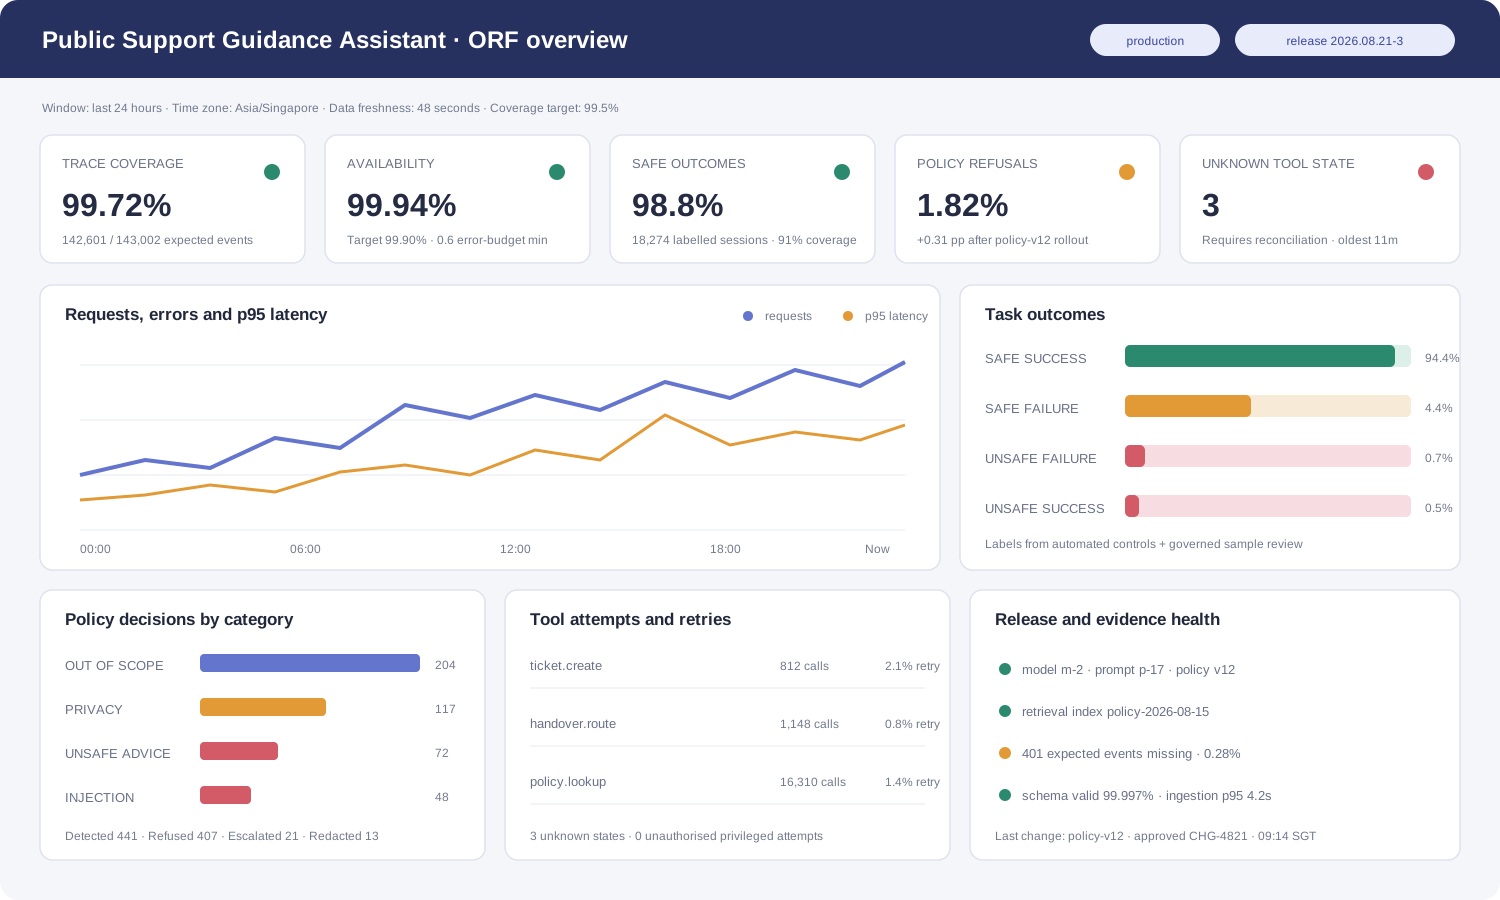
Fictional design example. Values illustrate presentation patterns, not recommended thresholds. Select the image to open it at full size.
Design four views
1. Service overview
For the on-call and service owner:
- availability, volume, latency, errors, timeouts, and saturation;
- task success/safe failure and unknown terminal states;
- model, retrieval, tool, and handover dependency health;
- current deployments and recent changes; and
- telemetry pipeline coverage and loss.
2. Agent behaviour
For AI/application engineers:
- task duration, steps, tool count, retries, and error lineage;
- model/token use by task and version;
- retrieval use and failure;
- refusals, policy decisions, handovers, and feedback; and
- links to individual traces through authorised investigation.
3. Safety and security
For security/privacy responders:
- policy detections and actions;
- harmful-output and sensitive-topic trends;
- privacy/classified-data incidents;
- privileged-tool, permission, token, and credential events;
- audit coverage/integrity; and
- open cases and containment status.
4. Governance and quality
For product, evaluation, and governance owners:
- critical-task and retrieval performance;
- safe/unsafe × success/failure outcomes;
- audit coverage and findings;
- safety-evaluation coverage for changes;
- incidents, recurrence, waivers, and overdue actions; and
- ORF requirement/evidence status.
Dashboard design rules
- show count, denominator, rate, and collection coverage together;
- annotate model, prompt, policy, data, and deployment changes;
- expose current filter, time zone, window, and calculation version;
- include sample size and uncertainty for evaluation metrics;
- show freshness and last successful ingestion;
- use bounded low-cardinality dimensions;
- link from aggregate to trace or case through controlled access; and
- state metric owner and response playbook.
Alert design
| Alert class | Example trigger | First response |
|---|---|---|
| Evidence loss | trace/event coverage or collector delivery below threshold | protect consequential actions; restore collection; assess evidence gap |
| Runaway agent | steps, duration, tool calls, retries, or cost above safety limit | interrupt/circuit-break; inspect task and external side effects |
| Reliability | availability/error/timeout/queue SLO breach | follow service runbook; identify component and affected journeys |
| Safety policy | confirmed/high-confidence harmful output or control bypass | contain affected flow/release; preserve incident trace |
| Privacy/security | sensitive-data leak or unauthorised privileged action | invoke security/privacy incident process immediately |
| Quality regression | governed critical-task metric crosses threshold | pause rollout or route to human review; investigate version/cohort |
| Change control | unapproved artefact version or missing safety evaluation | block/pause release; notify change owner |
Avoid alert fatigue
Every alert needs an owner, urgency, decision, runbook, deduplication key, and closure condition. Use tickets or scheduled review for slow-moving good-to-have analytics. Remove or redesign alerts that repeatedly fire without action.
Test before production
Generate a controlled trigger and verify:
- the correct team receives one actionable notification;
- severity and context are correct;
- links resolve for authorised responders;
- sensitive content is absent from notification channels;
- the runbook produces a safe decision; and
- acknowledgement and resolution are recorded.
Done when: operators can understand current service risk in minutes, and every production alert has a tested action path.
Next: Runbooks and response