LLM Observability Reference Implementation
A practical reference implementation of observability patterns for LLM and retrieval-augmented generation (RAG) applications. It uses Singapore property data to illustrate the workflow, while the same architecture and patterns can be applied to other datasets and domains.
Reference implementation, not a complete compliance assessment
This reference implementation demonstrates practical observability patterns aligned with the ORF. It is an implementation example rather than a compliance assessment. Applicability and verification depend on the deployment context, risk tier, and retained evidence; reassess these when adapting the implementation to another use case.
Example profile
| Field | Example decision |
|---|---|
| System | Chat and RAG application with an observability backend |
| Intended use | Demonstrate traces, evaluation, feedback, safe failures, and investigation workflows using non-consequential test data |
| Sample domain | Singapore property records; illustrative and replaceable |
| Out-of-scope uses | Eligibility, legal or financial decisions; case-record access; transactions; autonomous external actions |
| Users | Developers, reviewers, and test operators in a local or private environment |
| Risk tier | Illustrative Low-Risk deployment context; re-profile before public or consequential deployment |
| Main components | React UI, FastAPI API, model and embedding endpoints, Qdrant, Langfuse, and optional AWS infrastructure |
| External actions | None; the application retrieves data and generates responses |
The risk tier belongs to the deployment, not the codebase. The same application could become Medium- or High-Risk if it is exposed publicly, processes sensitive data, informs consequential decisions, or gains tools that change external state.
Reference architecture
User and session
      │
      ▼
React interface ── feedback linked to response trace
      │
      ▼
FastAPI application ── trace ID and request metadata
      ├── model generation
      ├── embedding generation
      ├── Qdrant retrieval
      ├── relevance / faithfulness evaluation
      └── safe-failure classification
              │
              ▼
           Langfuse
      traces, spans, scores, tokens,
      latency, cost, feedback, override
The application-level trace is useful evidence, but it does not represent a distributed trace across the browser, API, model gateway, vector store, and observability pipeline.
See the implementation in operation
These screenshots come from the running local reference implementation. User, session, trace, prompt, and response identifiers have been replaced with demonstration values. Metrics, span names, model names, and failure classifications remain visible so the images can illustrate the implementation and its investigation workflow. Retain trace, query, test, and configuration records separately as implementation evidence.
The screenshots use the earlier signal label refusal_type for technical and scope-related safe failures. The published source uses safe_failure_type; reserve refusal_type for an actual policy or model refusal.
Operational overview
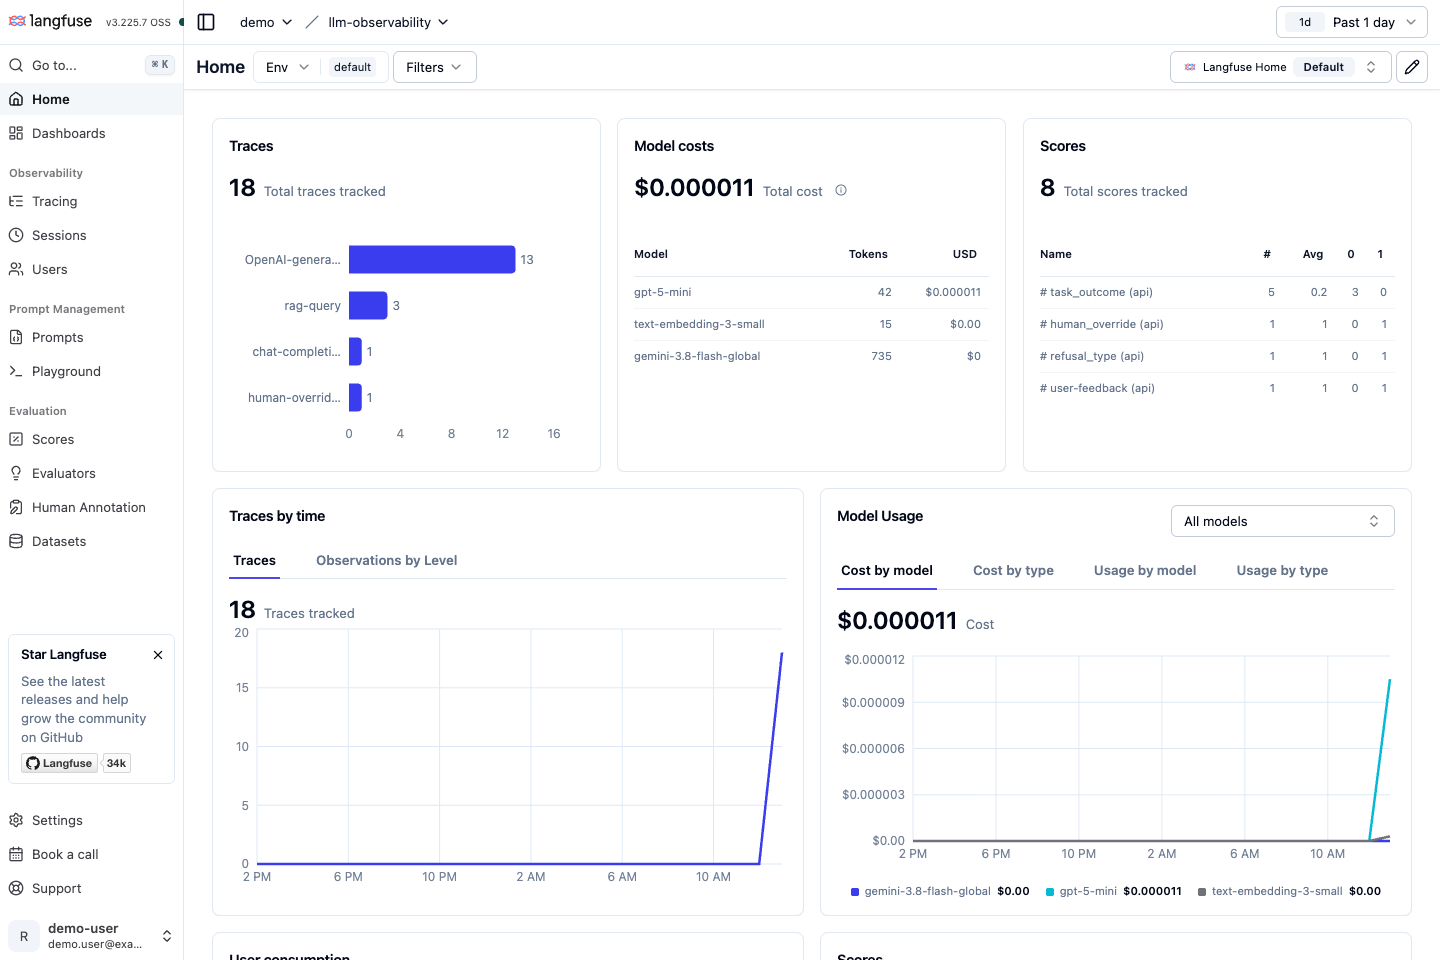
The overview combines request volume, model usage, cost, and evaluation scores. In a production deployment, turn the applicable signals into owned dashboards and alerts rather than treating the observability tool's home page as the final control.
Related ORF items: The view contains signals relevant to ORF-SYS-07, ORF-PERF-03, ORF-UX-06, and ORF-SYS-13. It does not by itself show throughput and queue length, the four-category outcome distribution, the feedback satisfaction rate, or complete cost allocation.
RAG trace investigation path
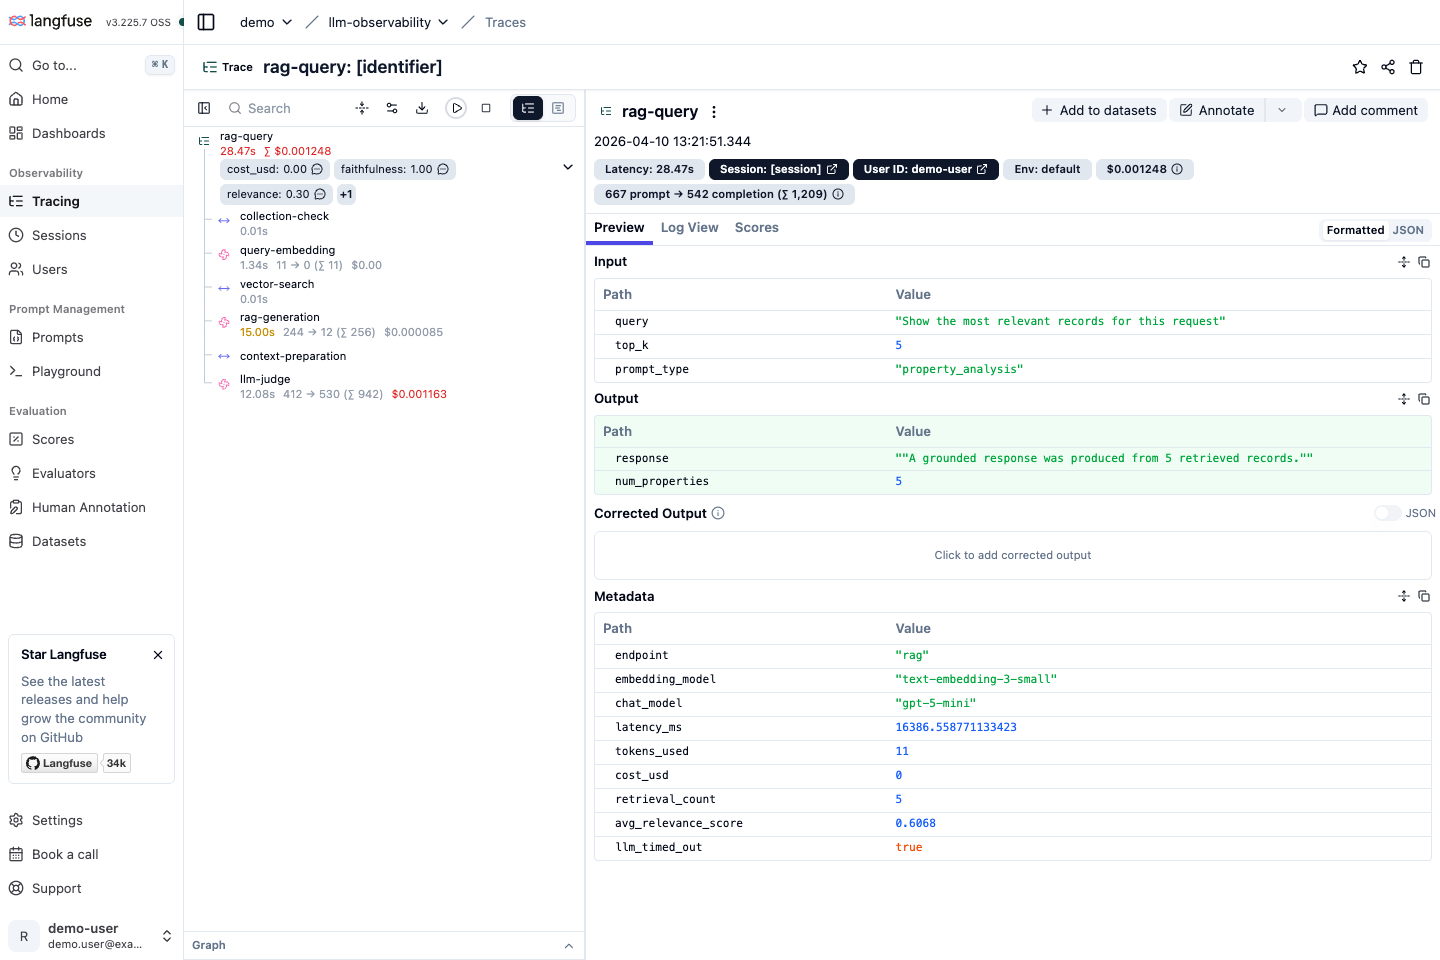
One request links the collection check, query embedding, vector search, context preparation, response generation, and LLM-based evaluation. The same view exposes latency, token usage, estimated cost, retrieval count, and quality scores. The timeout flag also illustrates why a trace must be interpreted rather than counted as automatic proof of success.
Related ORF items: The trace illustrates evidence relevant to ORF-AGT-01, ORF-AGT-03, ORF-AGT-04, ORF-SYS-03, and ORF-SYS-13. It does not show the claim-to-source edges required by ORF-AGT-07.
Safe-failure investigation path
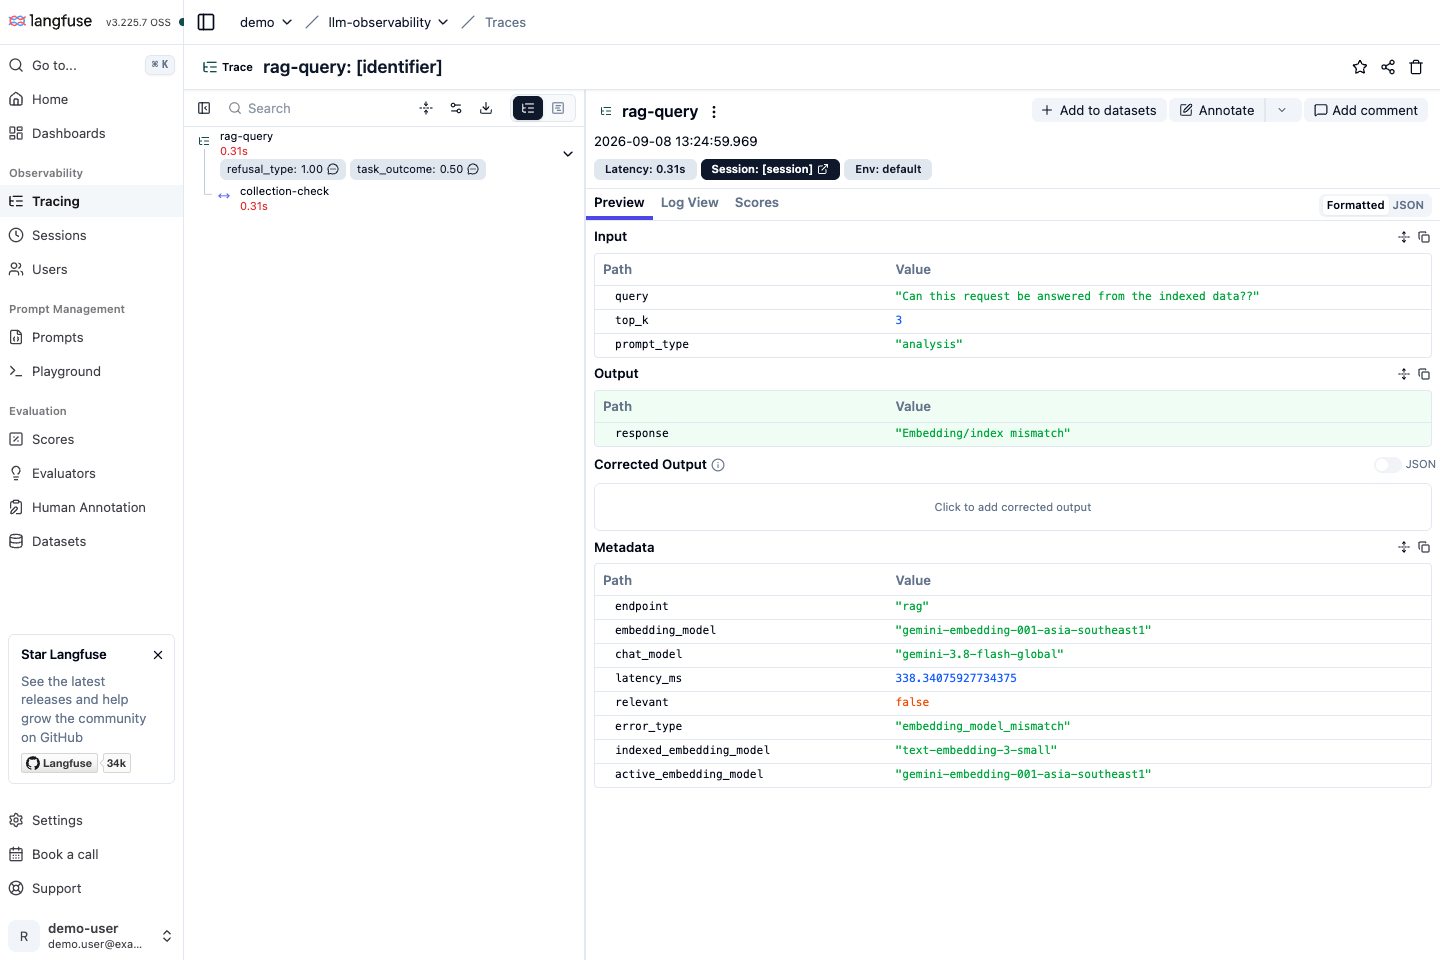
The application stops before unreliable retrieval when the active embedding model does not match the model recorded for the index. The trace retains the failure type, both model versions, latency, and outcome score needed to investigate and recover.
Related ORF items: The trace illustrates evidence relevant to ORF-AGT-05, ORF-PERF-03, ORF-AGT-04, and ORF-SYS-04. It is partial evidence: the numeric outcome is not the categorical distribution required by ORF-PERF-03, and the screenshot does not show every field required by the ORF-SYS-04 request record. Here, safe_failure_type identifies a technical safe failure.
Click an image to open it at full resolution.
What is instrumented
Chat path
chat-completion
└── chat-generation
    └── response, token usage, latency, estimated cost
└── llm-judge
    └── relevance and helpfulness scores
RAG path
rag-query
├── collection-check
├── query-embedding
├── vector-search
├── context-preparation
├── rag-generation
└── llm-judge
    └── faithfulness and relevance scores
Each request receives a trace ID. The UI can submit response-linked feedback, and an override endpoint can attach a human correction and reason to an existing trace.
ORF evidence demonstrated by the implementation
The table covers requirements for which evidence can be inspected directly in the implementation. The descriptions indicate how much of each requirement the evidence supports; they are not formal implementation or verification statuses. Use the full requirements register to assess applicability and record a status for every ORF item.
| ORF item | Evidence shown | Evidence and boundary |
|---|---|---|
ORF-AGT-01 |
Partially demonstrated | Generations record prompts, responses, timestamps, and token usage. Content redaction and restricted evidence storage require deployment-specific controls. |
ORF-AGT-03 |
Partially demonstrated | The RAG trace records the query, collection, result counts, scores, and generation context. Stable source-document evidence references and data classification are not demonstrated. |
ORF-AGT-04 |
Partially demonstrated | A trace ID links application spans. Cross-service OpenTelemetry propagation and measured trace coverage are not demonstrated. |
ORF-AGT-05 |
Partially demonstrated | Exceptions update the trace and outcome score. A governed error schema, stack hash, alert, and retained test evidence require additional evidence. |
ORF-AGT-07 |
Partially demonstrated | Retrieval and response generation share a trace, but claim-to-source edges are not recorded. |
ORF-PERF-02 |
Supporting capability present | A human override endpoint records the original response, correction, and reason. Protection and access policies depend on the deployment. |
ORF-UX-01 |
Partially demonstrated | Low-relevance queries are classified as out of scope and retained with the request trace. The required governed taxonomy and out-of-scope rate are not shown. |
ORF-UX-06 |
Supporting capability present | Thumbs-up/down feedback is tied to the response trace ID. The required satisfaction-rate calculation and coverage are not shown. |
ORF-SYS-03 |
Partially demonstrated | RAG generation has a timeout and fallback. Counts by dependency, route, and tool are not aggregated in the example dashboard. |
ORF-SYS-04 |
Partially demonstrated | Chat and RAG requests produce application traces with route, session, and model metadata. The complete timestamp, request, service, endpoint, status, latency, and byte fields are not all shown. |
ORF-SYS-13 |
Partially demonstrated | Estimated model and embedding costs are recorded per request. Complete allocation across relevant cost components and pricing/version governance are not shown. |
ORF-SEC-13 |
Partially demonstrated | Prompts, responses, retrieval, and generation are traceable, but access, retention, deletion, integrity, and redaction controls require separate evidence. |
Metric examples
task_outcome is an implementation-specific numeric convention used by the demonstration dashboard. It should not replace the explicit outcome categories required for operational analysis.
| Signal | Current interpretation | What an operator can learn |
|---|---|---|
task_outcome = 1.0 |
Request completed | Completion volume and success trend |
task_outcome = 0.5 |
Legacy numeric convention for a safe failure or human override | A coarse demonstration trend only; do not use it as the governed outcome classification |
task_outcome = 0.0 |
Request failed | Error trend and affected traces |
relevance |
Judge score for how directly the answer addresses the request | Potential response-quality regression |
faithfulness |
Judge score for whether a RAG answer is supported by retrieved context | Potential grounding weakness; not a substitute for labelled evaluation |
safe_failure_type |
Technical or scope reason such as no collection, no results, embedding mismatch, or out of scope | Why requests do not complete normally; reserve refusal_type for policy or model refusal |
cost_usd |
Estimated request cost using configured model rates | Cost trend by route, model, or session |
To align operational reporting with ORF-PERF-03, emit a separate categorical field rather than attempting to infer the outcome from the numeric score. Record human override separately from task outcome:
outcome_type: safe_success  # one of: safe_success, safe_failure,
                            # unsafe_failure, unsafe_success
human_override: false       # record separately from task outcome
Worked failure scenario: embedding/index mismatch
The application stores metadata about the embedding model used to build the vector index. When the active embedding deployment differs from that metadata:
- the request trace records both embedding versions;
- generation is stopped before an unreliable vector search proceeds;
task_outcomerecords a safe failure;safe_failure_typerecordsembedding_model_mismatch;- the response tells the operator to rebuild the index; and
- the trace ID provides the starting point for investigation.
This demonstrates detection and safe containment. Operational readiness would additionally require an alert threshold, an approved runbook, a completed exercise record, and evidence that recovery restored retrieval quality.
Reusing the implementation with another dataset
When replacing the sample property data:
- document the new intended and prohibited uses;
- reassess users, consequences, data classification, and risk tier;
- define a collection schema and stable source identifiers;
- update the domain prompt and retrieval evaluation dataset;
- define what counts as relevant, grounded, unsafe, and successfully completed;
- update privacy and retention rules before recording content; and
- rerun the requirements register and acceptance tests.
The instrumentation pattern can remain similar, but its thresholds, protections, operational actions, and mandatory ORF requirements may change substantially.
Scope boundaries and extension opportunities
This reference implementation focuses on application-level LLM and RAG observability. Depending on the deployment context and applicable policy, required extensions may include:
- redact or tokenise personal and sensitive content before trace storage;
- propagate trace context across services and measure trace coverage;
- add request, error, timeout, throughput, queue, and resource metrics;
- add safety, privacy, access-denied, credential-use, and leakage signals where applicable;
- connect model, prompt, configuration, and index versions to approved change records;
- retain alert, acceptance-test, and runbook-exercise evidence; and
- derive each recorded ORF status from item-level implementation and retained evidence.
Source availability
The source code used for this example is available in the LLM Observability Demo repository. Pin the repository release or commit used when retaining these materials as implementation evidence.
Continue through the playbook
- Use the system profile to re-scope the application for a new domain.
- Record all catalogue decisions in the requirements register.
- Specify protection and reliability in the telemetry design.
- Link supporting evidence in the evidence register.
- Compare with the public-service guidance assistant to see an illustrative High-Risk lifecycle.